In this blog post, I will be using the scale of analysis to talk about how we looking at a different point of view, or scale can change our perception of a country or place. For example, everyone might think the U.S.A is a rich country and where everyone’s dream can succeed, but there are some poor cities within the U.S.A. If we look at the poor cities in USA, such as Detroit and Milwaukee, the people live in there are suffering and have a really bad time compared to most other places in America.
Scale of analysis will help us to change our perception of a country or place. To make the Scale of analysis is spatial extent of something, such as data, religion, culture. In this blog post I will be doing some the data’s analysis in different scale, which includes Natural increase rate and GDP per capita. By analyzing a place, we can look at different scales, such as global, regional, and local, which these are the scales that I will be talking about. Global scale in this blog post will be talking about the countries around the world and the countries that has highest number or lowest number of the data that I’m analyzing. Regional scale is the world’s major region, especially Europe. Local scale will be the cities or regions within the country.
What come to people’s mind about Italy might be rich, it’s true in some cases, but it is not right when we are analyzing the data of natural increase rate (NIR) of Italy. The Natural increase rate (NIR):
Natural increase rate is difference between the number of live birth and death occurred in the year and divided the number by the population and multiplied by a factor. We will start off from global region and go to more specific later.
| Country Name | Natural increase rate (NIR) |
| Niger | 3.9% |
| Serbia | -0.5% |
| Italy | -0.1% |
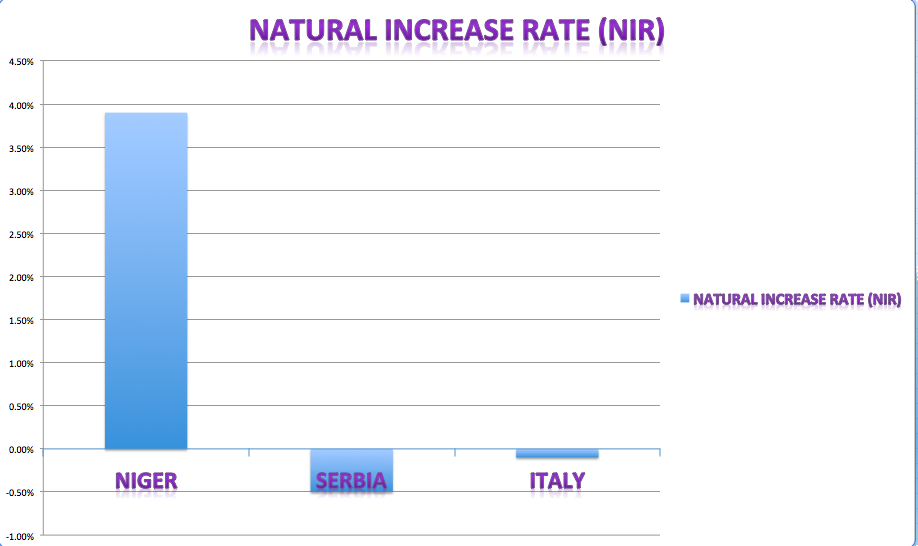
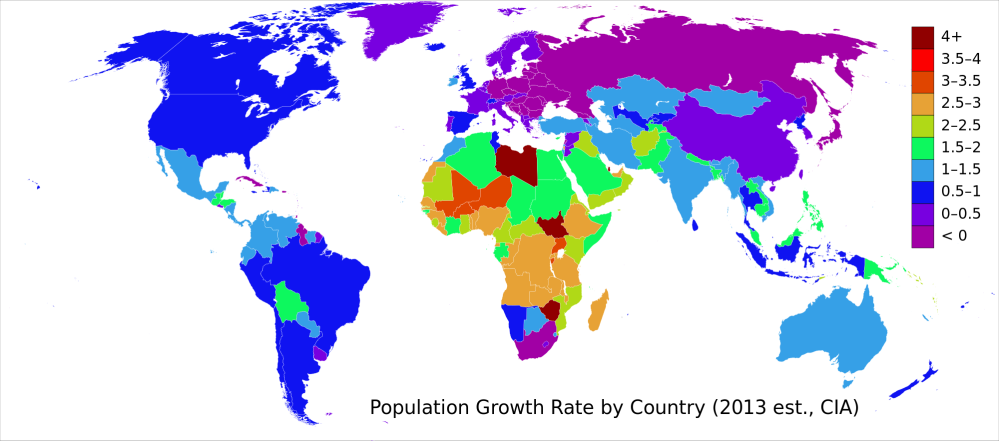
This picture shown the country that has the highest NIR, the country that has the lowest NIR, and the NIR that Italy has.
Niger has the highest rate of natural increase in the world, while Serbia has the lowest natural increase rate in the world. Italy has one of the lowest natural increase rate in the global region. Italy is not rich in NIR if we just compare it with all the places around the world, but we will be able to find Italy as a place that is a bit better than we saw.
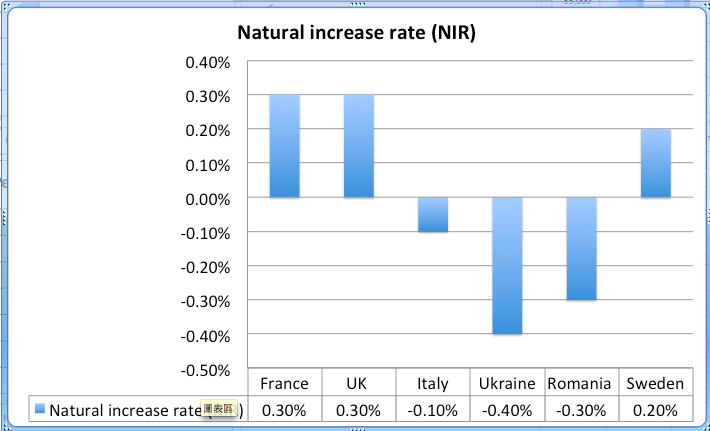
Now, take a closer look at the comparison of the Natural increase rate of Italy. The picture below will show the countries that are in the same region, which is Europe and data of NIR that they have.
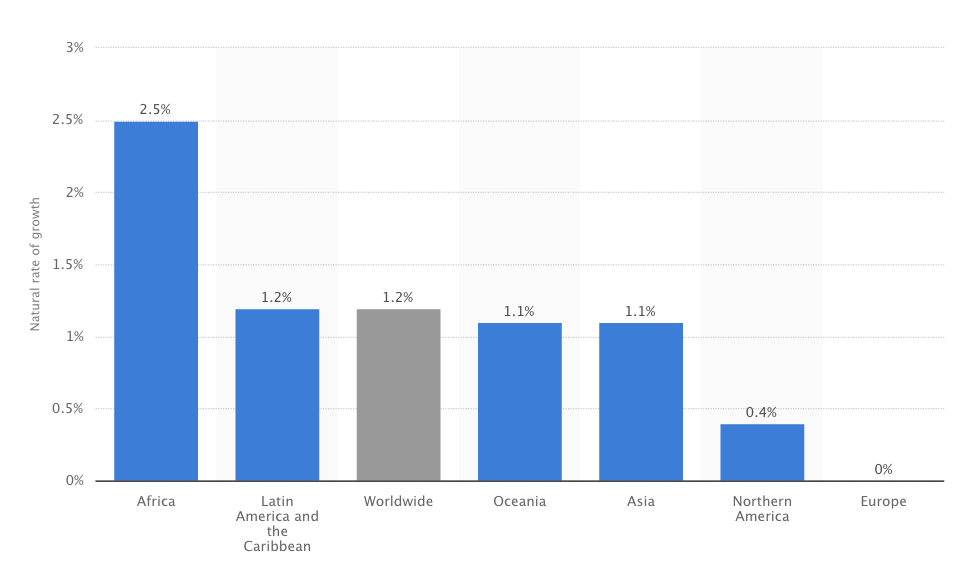
In this picture, Italy’s NIR is around the center. Now that’s look at the global region again, which is that the NIR of Italy is close to the country that has least number of NIR. From this we can tell that by looking at different scale of analysis, it can change our perception of a place. Also, we can compare Italy’s NIR with the world major region average NIR, which will be show in the picture below.
From this picture, we can tell Italy has the NIR that is lower than every world major region’s average of NIR. Even lower than the region that Italy is in, which is Europe who has 0% of NIR in average of it’s countries. From this we may get to the conclusion that the NIR of Italy is low, but if we look at Italy more specific, we can tell what part of region is lower than the other and made them have that low natural increase rate.
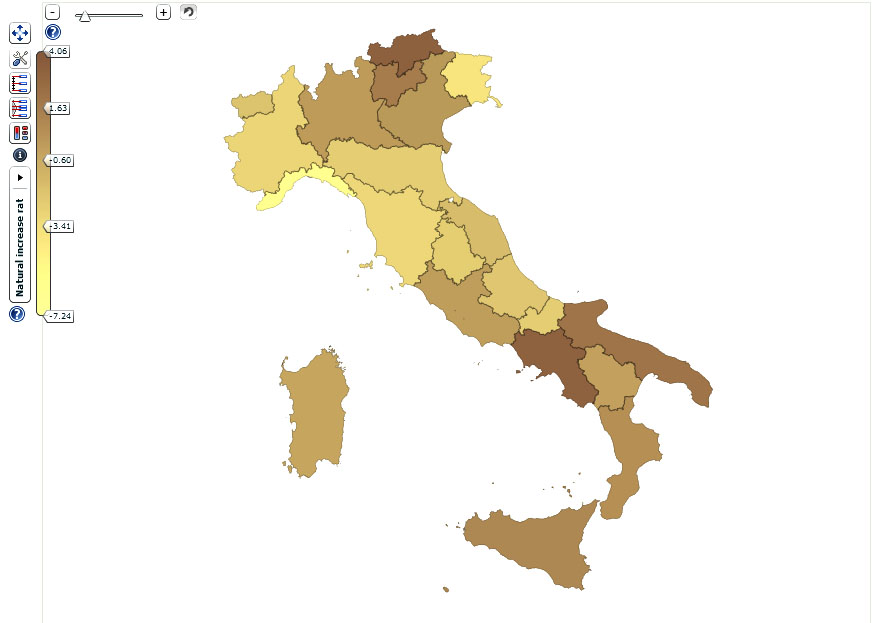
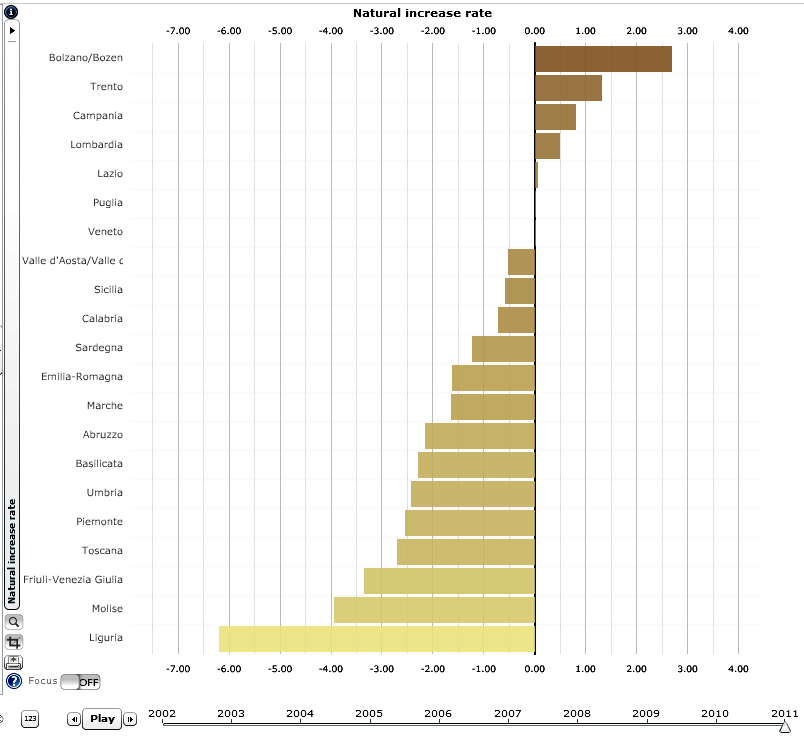
The two pictures below shows the NIR of each region with in Italy.The map and data are from http://noi-italia2013en.istat.it/.
From the information above, Bolzano, a region located in Northeast Italy has the highest GDP per capita in Italy, and Liguria, a region located in South Italy has the lowest GDP per capita in Italy. Lazio, one region in central Italy with the capital located in there, has one of the higher GDP per capita in Italy. From this we can tell that not always the capita has the highest number of data within a country. The NIR that the regions in Italy have are most really low, so Bolzano’s NIR didn’t change Italy’s NIR significantly, but if we look in the other way, we will find out the Significance of this data. That’s look at look back to other scale, Bolzano is a region that has the NIR that is higher than many countries and it ‘s even higher than its own country by more than 2.5%. This is significant because it is higher than many world major region, many countries, such as Ukraine and Serbia, also the number Bolzano has is a lot closer to Niger than Italy itself.
Moving on to the scale of analysis of GDP per capita. According to Investopedia, “GDP per capita is a measure of the total output of a country that takes the gross domestic product (GDP) and divides it by the number of people in the country.” We will start off by talking about the global region.
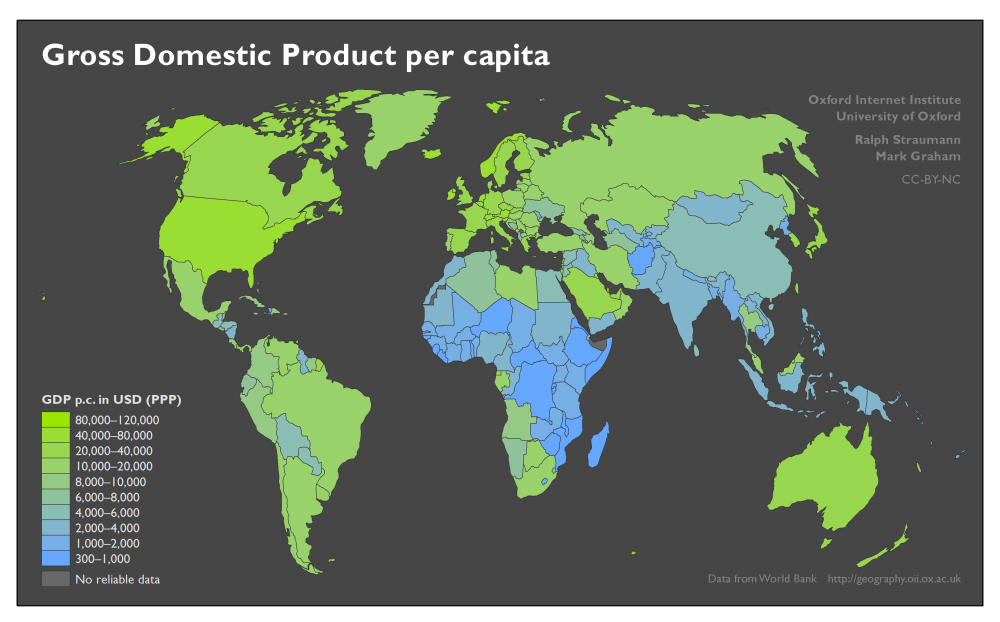
The map and data below are from World Bank.
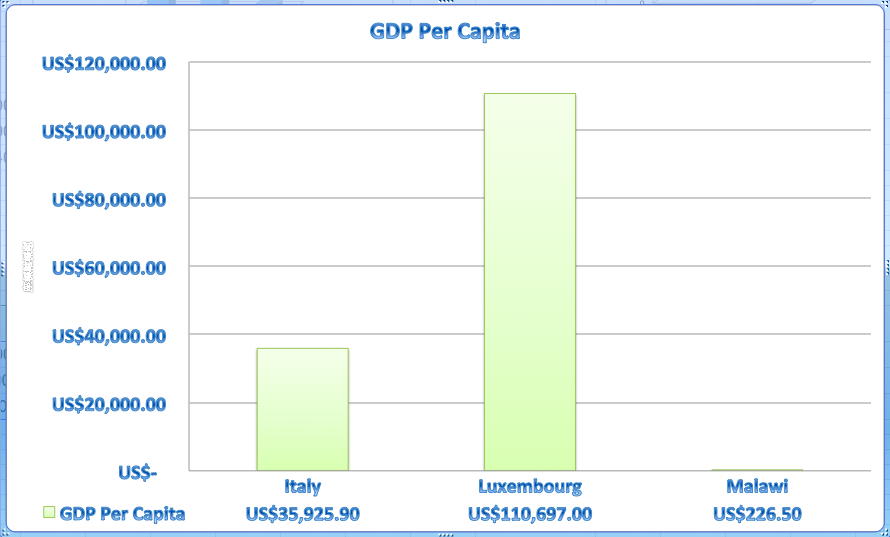
This picture shown the country that has the highest GDP per capita in the global scale, the country that has the lowest GDP per capita in the global scale, and the GDP per capita that Italy has.
From the map and data above, Luxembourg, one of the countries in Europe that is between Germany and France, has the highest GDP per capita in the world, but Malawi, which is located in Southeast Africa, has the lowest GDP per capita in the world. GDP per capita of a country can be really low, like Malawi, but it can also be really high, like Luxembourg. In Italy’s case, if we just look at the whole world region Italy is extremely low, it’s not even the half of what Luxembourg have, but later on, after we go into more detail, we can find some surprises about Italy.
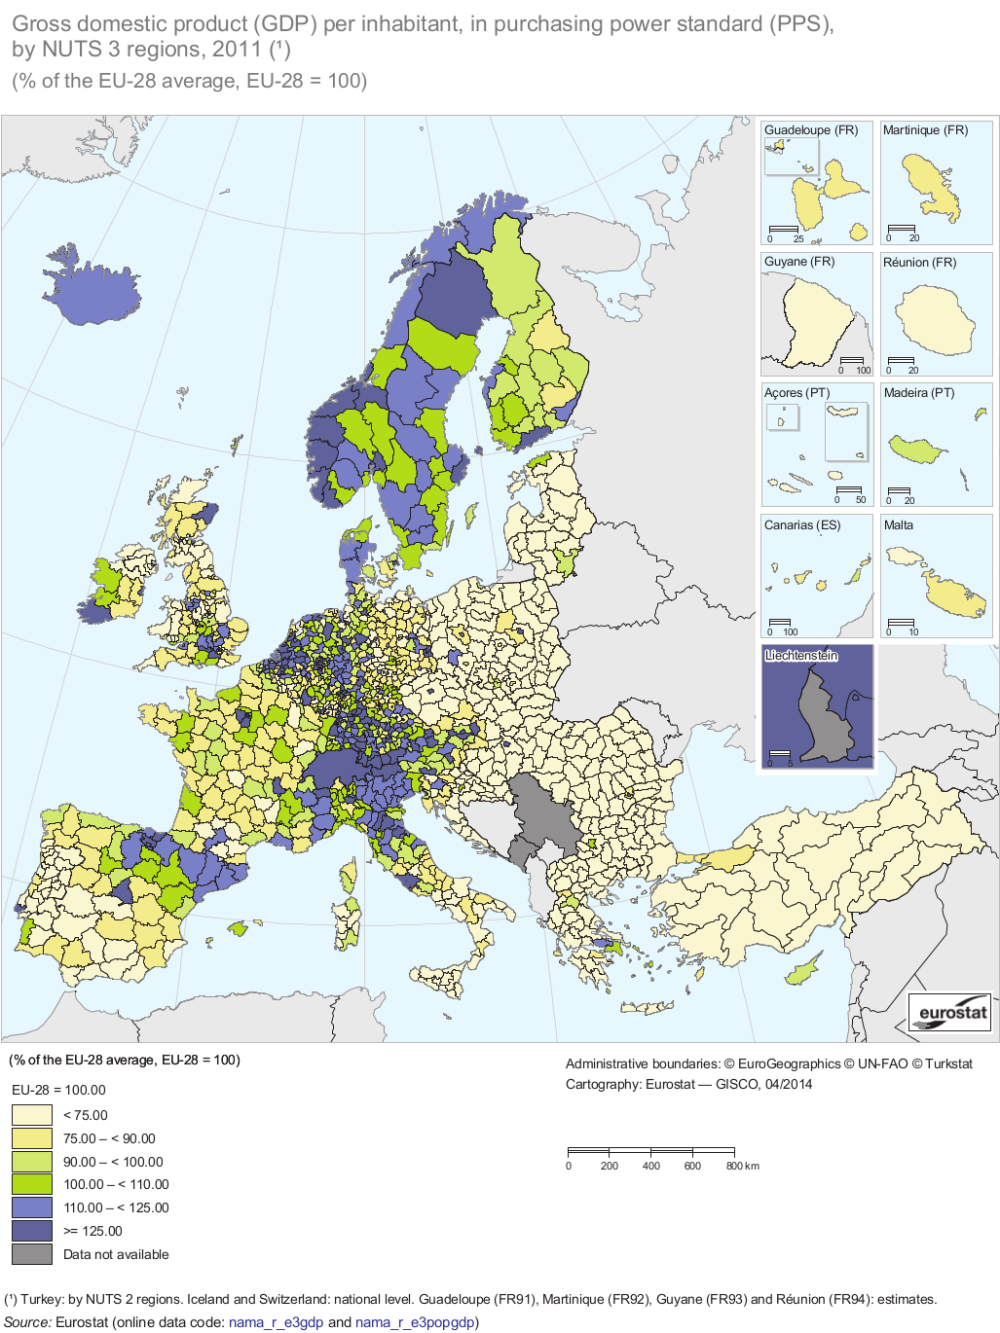
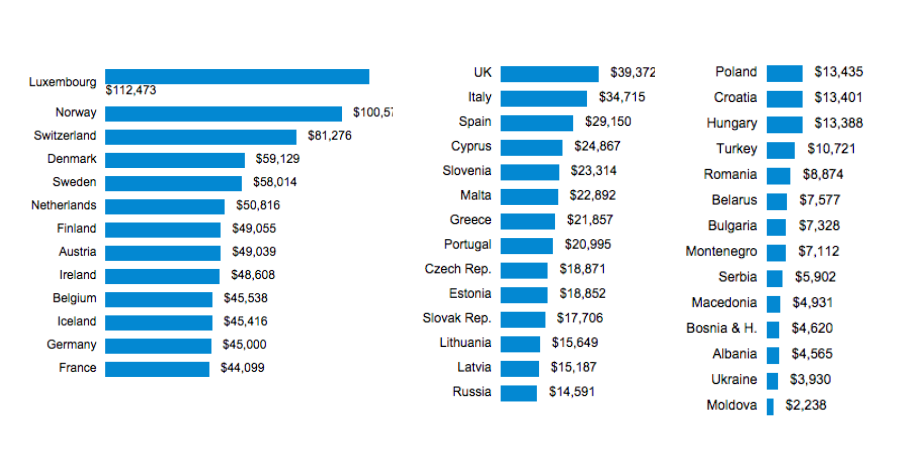
The second picture is from www.globalpropertyguide.com. Both picture’s data above were gather in 2014.
As we can see from two pictures above, Luxembourg is still the one who has the highest number of GDP per capita, but if we look closely on the second picture, Italy is better than at least half of the countries in Europe. Again, by looking at different scale, can change our perception of a place, such as Italy, who looks like having a really little amount of GDP per capita on Global region, but has a number that is better than at least half of the countries in Europe.
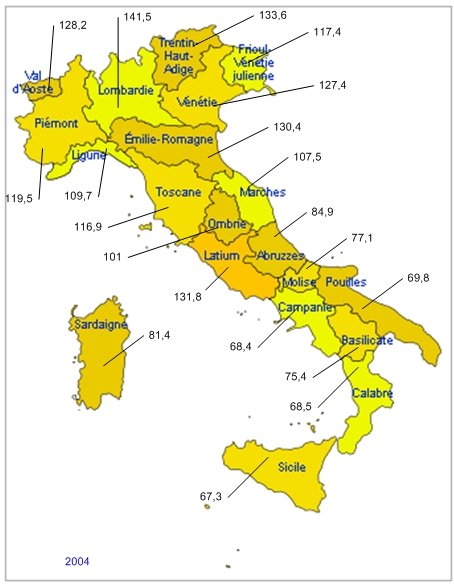
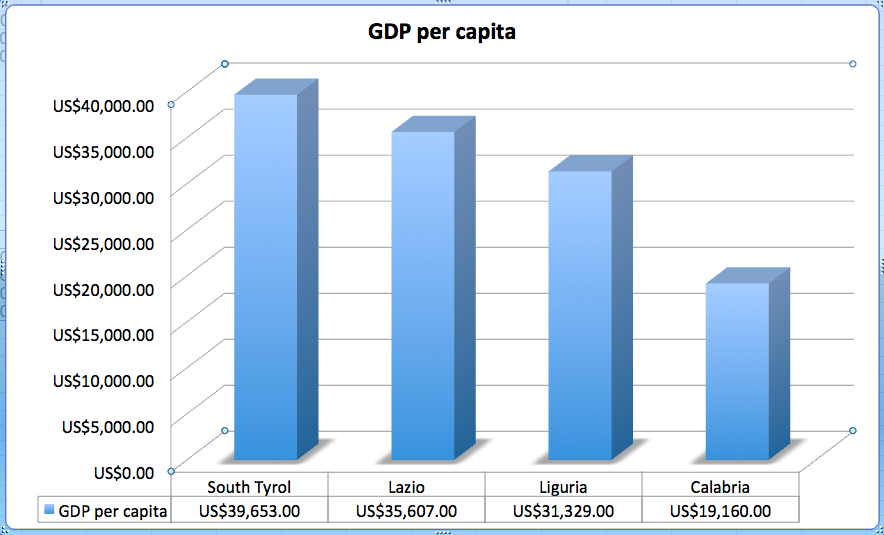
The next thing we are going to talk about is the GDP per capita of local regions within Italy, which the data will show below by the map and the graft. The data of map was gathered in 2004 and the data of the graft were gathered in 2008.
South Tyrol, the region that located in the very North of Italy, has the highest GDP per capita in Italy, and Calabria, a region located in the Southern Italy, has the lowest GDP per capita. Lazio is in central of Italy and it’s where Rome located too. Liguria is located in Northern Italy, and Genoa, a city is located in there too; Liguria has the number of GDP per capita that is the middle of every region in Italy.
Italy’s GDP seems low in the global scale when we are doing the scale of analysis, but when look at the regional scale, it seems the number is fine. Then later on, when we look at the GDP per capita in the local scale of Italy, the GDP per capita is pretty high. The lowest number GDP per capita is just around the half of the richest region in Italy. The local region’s GDP per capita is high, which allow Italy have more GDP per capita in the world and regional scale, even though the number of it is still low on global scale. From what I did here, is to look at and change the scale of analysis into different region or scale, and it will help us to change our perception of a place.
